Drop a pin
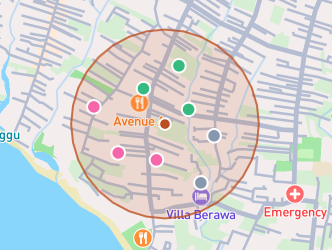
Pick from our area catalogue, pin an exact location on the map, or paste a Google Maps link. Most coordinates in Bali work.
Drop a pin anywhere in Bali. We pull every active comparable listing within your radius and return an interactive report: real revenue, occupancy, ADR, sale supply, and ROI simulation. In your inbox in under ten minutes.
| comp | rev/yr | occ | adr |
|---|---|---|---|
| 3BR · 80 m | $61,200 | 74% | $226 |
| 3BR · 140 m | $52,800 | 69% | $210 |
| 2BR · 170 m | $38,400 | 66% | $159 |
| 3BR · 190 m | $44,700 | 61% | $201 |
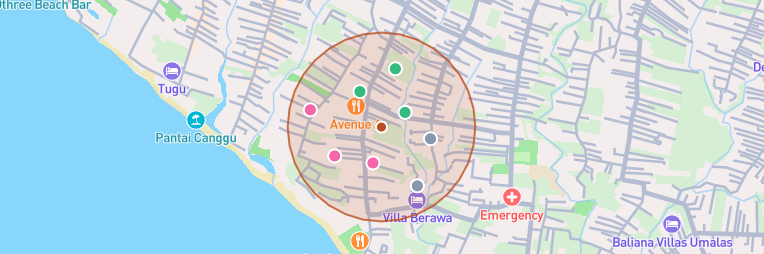
Pick from our area catalogue, pin an exact location on the map, or paste a Google Maps link. Most coordinates in Bali work.
Our system pulls every active comparable listing around your pin, runs the analysis, and packages it into an interactive report.
Delivered in under ten minutes. Not a PDF. A live tool with sortable comps, charts, and an ROI calculator you keep forever.
Limited preview of report sections.
Active listings grew from zero to 678. New market emergence, not stable supply yet.
Occupancy −13% (fewer nights booked versus the prior period). Seasonal months still move results month to month.
Top tier $148/night, market average $110, bottom tier $86. Wide spread across performance bands.
Indicates whether your pinned area (all bedroom types) is behaving stronger or weaker in the short term.
−6
Balanced market
Listings grew from zero. Forming market, not stable supply yet.
Recent occupancy is 13% lower than the prior period.
Execution-sensitive market. Average positioning is exposed.
13 comparable 1BR villas within 500 m of your pin.
Breakdown of every comparable in your area. See Airbnb listing, revenue and trends.
| # | listing | rev/yr | occ | adr | adr trend | yoy rev | revpar |
|---|---|---|---|---|---|---|---|
| 1 | Exquisite 1BR tropical pool | $38,403 | 79.7% | $132 | +32.2% | +18% | $105 |
| 2 | Coastal 2BR · pool access | $31,200 | 72.4% | $118 | +8.1% | −3% | $85 |
| 3 | Modern joglo · rice view | $27,427 | 64.0% | $110 | −4.6% | N/A | $70 |
| 4 | Studio · walk to beach | $18,900 | 58.2% | $89 | −12% | −9% | $52 |
| 5 | Garden villa · 2BR | $9,941 | 48.8% | $49 | −24.6% | −21% | $27 |
The live calculator lets you set purchase price, operating costs, and revenue tier, then stress-test both directions.
Is this market worth a closer look? Market tension index, key supply and demand signals, and a plain-language investor read on what is moving the area.
Is this market strengthening or under pressure? Supply dynamics, financials and booking trends, sale inventory, and a filterable supply explorer.
What do villas like mine or the one I am interested in buying actually earn here? Comparable property tables with revenue, ADR, occupancy, yield momentum, and investor flags.
Need the full breakdown? Sortable listing table, opportunity flags, revenue tiers, quality matrix, and investor KPI tables for every comp.
Does the deal survive a bad year? ROI calculator with operating cost assumptions and ±10% stress tests for your scenario.
Questions we get often about ArthaBase reports
Occupancy rates, ADR, revenue benchmarks, 36 months of seasonal data, comparable property tables, listing supply and supply-for-sale movement, and advanced ROI simulation for your chosen area and bedroom count.
Revenue, occupancy, and nightly rates come from active comparable properties in the target location, sourced via short-term rental data providers, local data partners, and ArthaBase proprietary data.
Estimates are based on observed booking activity and pricing data. They are directionally accurate for benchmarking, not a guarantee of future performance.
Buyers, researchers, villa owners, agents, operators, and investors who want actionable Bali villa rental data without relying only on opinions.
No. Use it to vet a location, compare neighborhoods, or research land and development opportunities before you buy.
No. ArthaBase provides market data for informational purposes only. Investment and financial decisions remain entirely your own. We show what the market has done and is doing, not what it will do.

Open the app, pin your target area, choose bedrooms. The free check shows the comp set before you spend a rupiah.
Try free area check