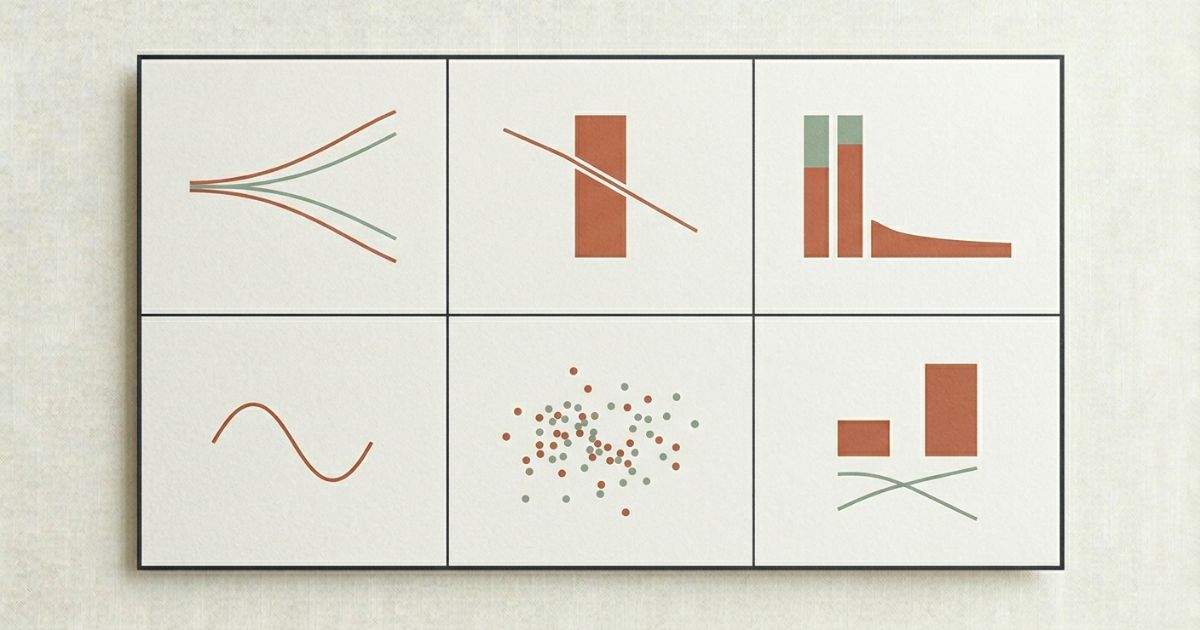
Six Market Patterns Every Bali Villa Investor Should Know How to Read
ADR divergence, RevPAR traps, revenue concentration. Six data patterns that repeat across Bali STR markets and what each one means before you invest.
On this page
Bali STR data contains patterns that repeat across areas and bedroom counts. Once you know what to look for, they become reliable signals for evaluating whether a market is worth entering, what kind of asset performs within it, and where the risk actually sits. Here are six worth understanding before you commit to anything.
1. ADR Divergence
In a healthy market, nightly rates across the comp set tend to move together. When a market comes under supply pressure, they split.
Illustrative comp set: premium tiers hold rate while lower tiers compete on price. The spread between top and bottom quartile widens as supply pressure builds.
What this tells you is that the market has bifurcated. Premium-positioned properties are defending their rate while lower-tier listings are competing on price to maintain occupancy. The gap between the top and bottom tier is not random. It reflects the difference between properties with a genuine reason to command a premium and those without one.
In practical terms: a 62% ADR spread between top and bottom quartile in the same area means design and positioning are doing most of the revenue work. Occupancy differences between tiers are often smaller than investors expect. The rate is what separates the outcomes.
All of this is visible in a comp-set report broken down by ADR tier.
2. The RevPAR Trap
Annual revenue is the number most buyers focus on. It is also the easiest number to be misled by.
A property can show flat or slightly growing annual revenue while its RevPAR declines steadily. This happens when an operator fills the calendar by cutting rates. The occupancy goes up, the revenue holds, but the yield per night quietly deteriorates.
Illustrative example: gross revenue holds while revenue per available night falls. Occupancy is filling the gap, not rate strength.
When evaluating a comp set, check whether RevPAR is tracking ADR or diverging from it. If RevPAR is falling while ADR holds, occupancy is the problem. If both are falling, the market has a structural demand issue.
3. Revenue Concentration
In most Bali comp sets, revenue is not distributed evenly. A small number of listings capture a disproportionate share of the total.
Illustrative comp set: top listings earn many times the bottom. The median sits well below what outliers achieve.
This matters because the median revenue figure sits well below what the top performers achieve. Landing in the top tier is not automatic. It requires deliberate choices around design, management quality, pricing strategy, and listing presentation.
Knowing the concentration structure of a comp set before you buy tells you whether you are entering a market where performance is broadly achievable or one where the upside is captured by a small number of outliers.
4. Cyclical vs Structural Weakness
Bali is a seasonal market and occupancy weakness in low season is normal. The question is whether the weakness is cyclical or structural, because the investment implications are completely different.
Cyclical weakness
Structural weakness
Index (100 = prior-year baseline). Cyclical weakness recovers in peak season. Structural weakness does not.
The chart that distinguishes the two is a seasonality heatmap alongside an occupancy momentum line. Cyclical weakness shows a consistent seasonal curve. Structural weakness shows that curve flattening and shifting downward over time.
Before entering any area, check which pattern the data shows. A market in cyclical weakness is a timing consideration. One in structural decline is a fundamental problem.
5. The Pricing-Occupancy Scatter
The conventional assumption in short-term rental investing is that occupancy drives revenue. Fill the calendar, earn more. The data in most Bali comp sets does not support this.
Illustrative comp set: highest-revenue dots cluster in the high-ADR tier, not at peak occupancy.
In most comp sets, the highest-revenue listings are not the ones with the highest occupancy. They are the ones in the highest ADR tier. A property charging $210 per night at 70% occupancy outperforms one charging $130 at 90%.
The investment case should be built around what rate a property can sustainably command, not what occupancy it can fill at any price.
6. Supply Surge vs Demand Floor
The final pattern is the one that most directly answers whether a market is worth entering at all.
When supply grows faster than demand can absorb, occupancy falls and rate pressure follows.
The pattern does not tell you to walk away. It tells you to pressure-test your assumptions against a market that is not in your favour before you decide.
These six patterns show up across most locations in Bali once you segment a comp set by bedroom count and radius. They do not replace judgment, but they make judgment better informed. In a market where most buyers are working from projections and opinions, reading the data correctly is the edge.
From patterns to one market read
Spotting a pattern in a chart is step one. Acting on it is step two. That is where ArthaBase reports go further than a dashboard export: the same signals you have seen here (and several more we do not publish in full) are run through our analysis pipeline on every report.
Supply momentum, demand momentum, pricing power, and revenue efficiency are weighted and combined into a single Market Tension Index (MTI). You get a score on the pressure-to-strength scale, a plain-language read on what is driving it, and a clear flag on whether the micro-market is strengthening, balanced, or under pressure. No filter maze. No guessing which chart matters most.
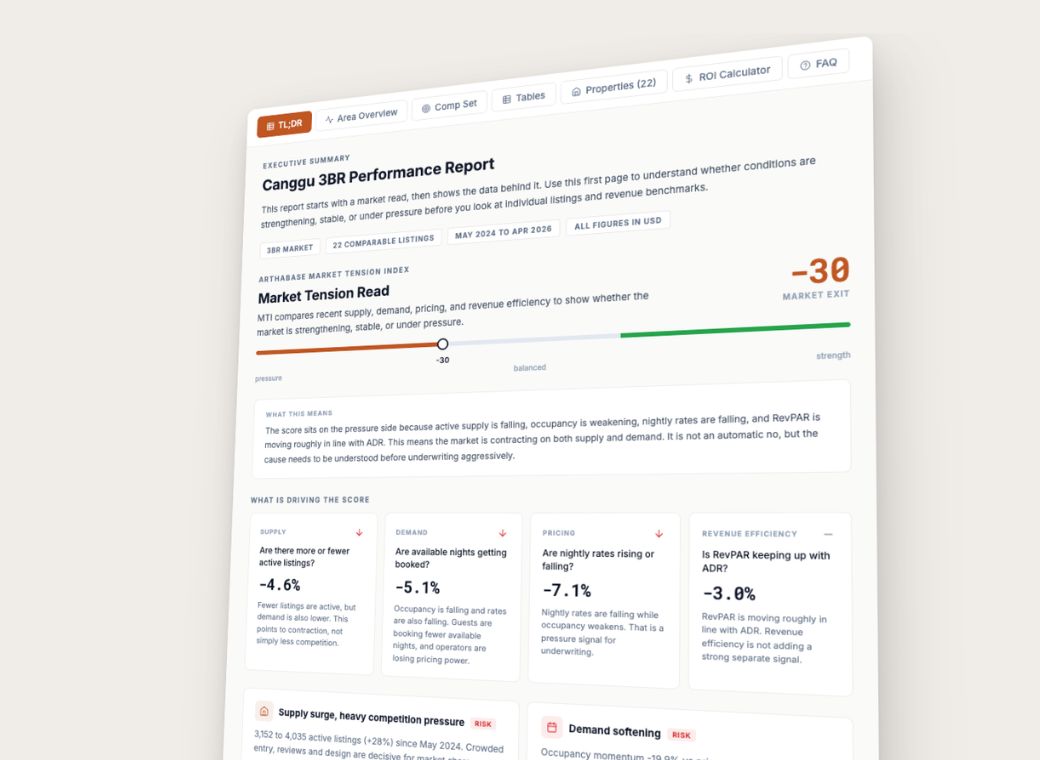
Example from a Canggu 3BR report: MTI collapses supply, demand, pricing, and RevPAR efficiency into one score plus a written read on what is moving the market.
The patterns in this article are the building blocks. The MTI is the synthesis. You still see ADR tiers, revenue ranges, seasonality, and comp-level detail in the report. You also get the headline answer investors actually need: is this location worth underwriting aggressively right now, or is tension building for a reason you need to understand first?
That is deliberate product design, not a data dump. We built ArthaBase so you spend less time chart-hunting and more time deciding.
If you are building a research workflow around these ideas, how to research a Bali villa investment and what to look at before buying walk through comp sets and payback in order. You can explore occupancy, ADR, and supply trends for most locations in Bali on ArthaBase.